Is the floor keeping up?
See throughput, units per hour, lines per hour, active time, and performance by user or location.
REPORTING & OPERATIONS ANALYTICS
ORCA turns the work already happening across orders, inventory, fulfillment, and finance into reporting your team can act on.
START WITH THE DECISION
A useful dashboard does more than describe the past. It shows where the operation is slowing down, what caused it, and where the team should act next.
See throughput, units per hour, lines per hour, active time, and performance by user or location.
Find aging orders, backorders, receipts, shipments, and unresolved exceptions before they become customer problems.
Connect availability, demand, inbound supply, forecast, stockout timing, and replenishment decisions.
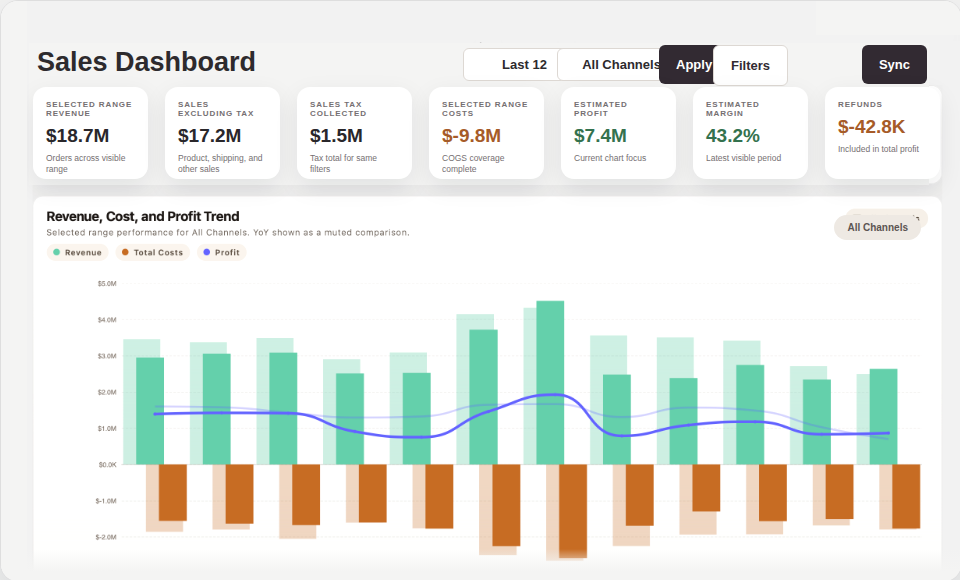
Understand shipped volume, revenue, cost, profit, margin, refunds, and channel performance.
WAREHOUSE PERFORMANCE
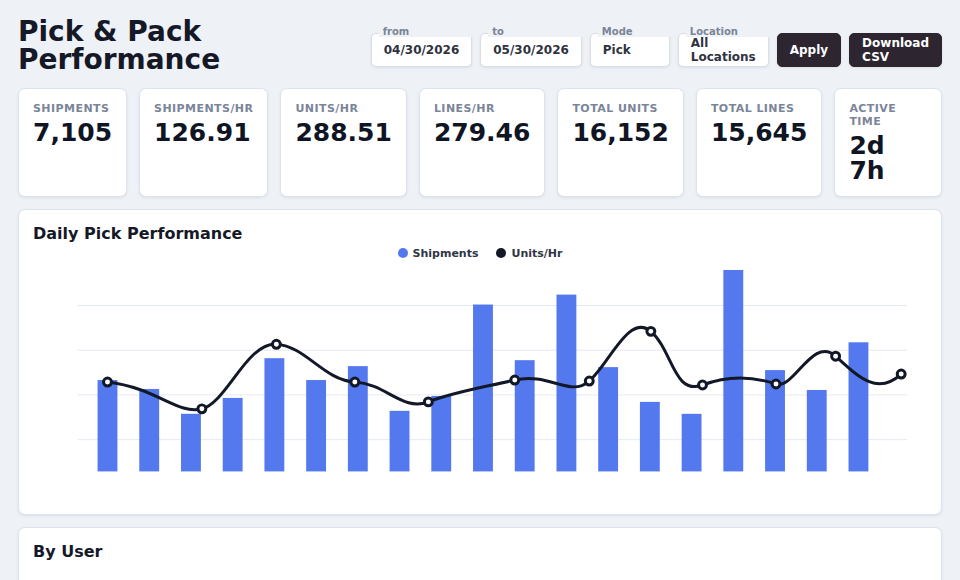
Totals alone cannot explain a warehouse. ORCA keeps performance tied to dates, users, locations, modes, orders, shipments, and the work that produced each result.
See pace and output together. Compare shipments, units, lines, and active time without rebuilding the report by hand.
Filter to the operation you manage. Review performance by date, location, workflow, user, or other operational dimensions.
Investigate the change. Use the records underneath the metric to understand what helped or held the floor back.
AGING & EXCEPTIONS
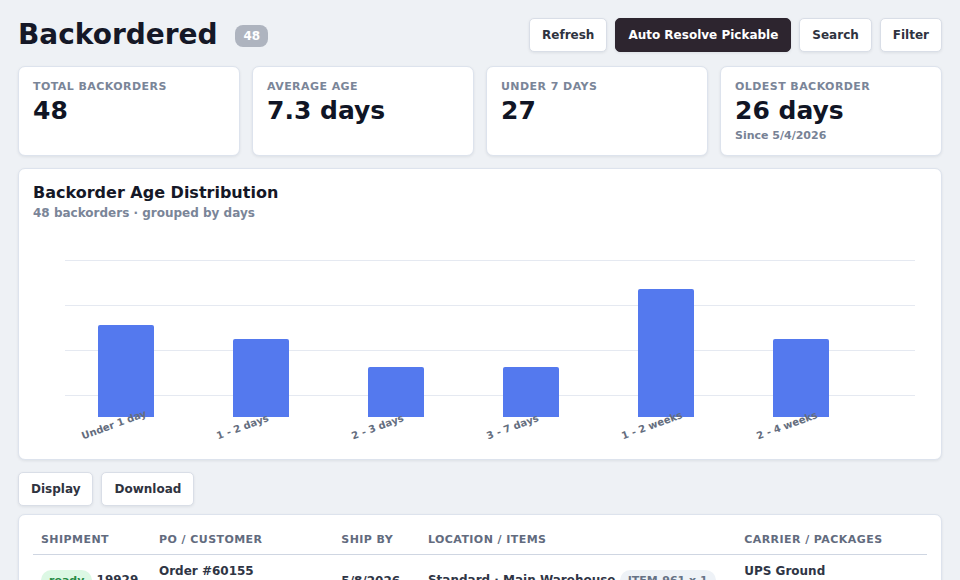
ORCA separates ready work from blocked work and keeps the reason visible. Managers can focus on the exceptions that are growing, repeating, or putting commitments at risk.
ONE SOURCE, DIFFERENT DECISIONS
Operators, managers, and leaders can work from the same underlying records without forcing everyone into the same dashboard.
See the next queue, the current target, and the exceptions that can be resolved now.
Work queues · Station output · Ready workSee throughput, capacity, aging, blockers, and completed work across the floor.
Performance · Aging · ExceptionsConnect inventory and fulfillment activity to revenue, cost, margin, and customer commitments.
Sales · Margin · Operational trendsREPORTING CONNECTED TO THE WORK
ORCA reporting is built from the operational records underneath it: orders, shipments, packages, inventory, users, events, invoices, payments, and integration requests.
That connection turns a dashboard from a presentation into a place to investigate and act.
Explore the connected platformSTART WITH THE QUESTION YOU CANNOT ANSWER
We’ll walk through the ORCA views that fit your warehouse, inventory, fulfillment, and business reporting needs.
Book a reporting demo